ArcGIS Diagrammer is productivity tool for ESRI’s ArcGIS Desktop users. Diagrammer is primarily used to create or view geodatabase designs in a graphical editor. This post will examine data reporting, a feature of Diagrammer that might be useful to a wide variety of ArcGIS Desktop users.
Let’s say that you or your organization has an existing geodatabase. You may want to ask:
- Does my geodatabase have any empty feature datasets?
- Does my geodatabase have any feature classes with no data?
- Does my geodatabase have any subtypes with no data?
- Does my geodatabase have any feature classes with holes?
Diagrammer’s data reporter will help answer these questions. Below is a short walk-through of creating a data report for a sample geodatabase that is included with ESRI’s ArcTutor product.
After starting ArcGIS Diagrammer, click Tools > Data Report.

A new tab will be added to the application called Data Report. If the Properties Window is not visible then click View > Properties. In the Properties Window, click the ellipsis (…) button next to the Workspace property.
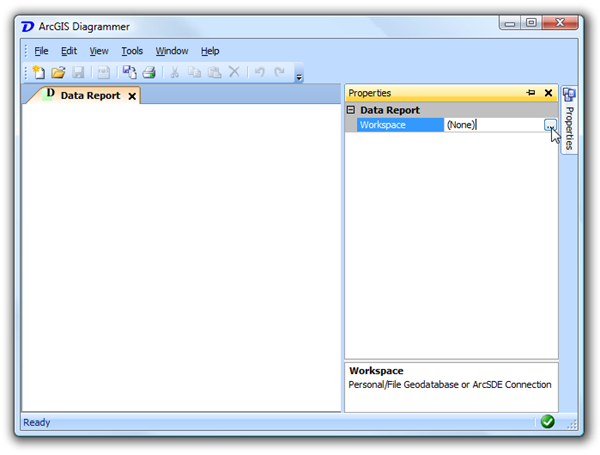
The ellipsis button will launch a dialog for navigating to (and selecting) a geodatabase or SDE connection. All geodatabase types are supported.

The selected geodatabase will be scanned for feature datasets, feature classes and subtypes. This may take a few seconds or minutes depending on the size and complexity of the geodatabase. When the scanning is complete a HTML report will be presented in the Data Report tab.

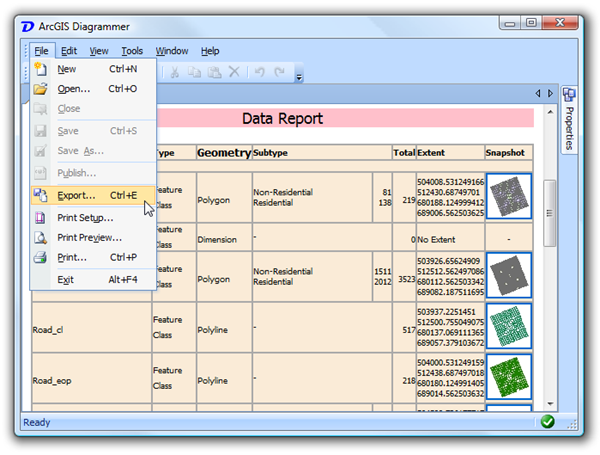
The report includes a header table and details about all feature classes, tables and subtypes. Most useful is the number of features/rows per feature class, table and subtype. Lastly, the report includes a small thumbnail representation of the data that, by default, hyperlinks to a larger image.

Data reports can be sent to a local printer/plotter or virtual printer should you wish to create a PDF document. Alternatively, reports can be exported to a new HTML document. To do so, click File > Export.
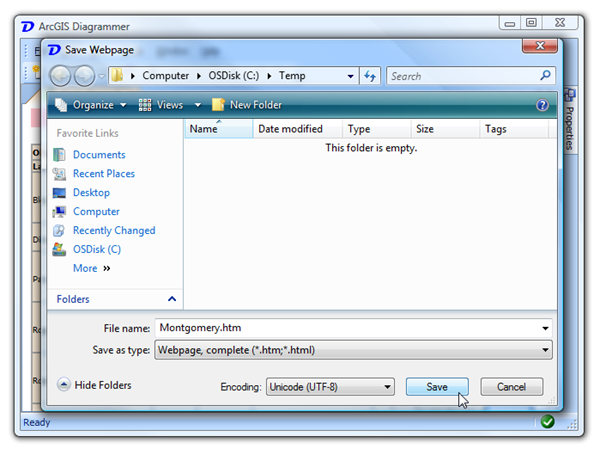
The save as dialog that appears will prompt you for the name and type of web document to create. By default, “web archive” is selected. We recommend you select “webpage, complete” as this will make a copy of the thumbnail images. The only disadvantage of exporting a report to HTML is that the larger linked images will not included in the output location. To prevent this, you can disable the creation of the larger images in the options dialog (see below).
This is an example of an export data report displayed in Windows Explorer.

When the exported HTML data report is viewed in a web browser, it looks identical to the report in ArcGIS Diagrammer.

Some options are provided to change the look and feel of data reports. To display the Diagrammer options dialog, click Tools > Options.

The data report options are located under the Report > Data tab. Most options are related to the font and the thumbnail images.

In the screenshot below I modified the font to be “Segoe Print” and increased the size of the small image to 200x200 and removed the larger linked image (Show Large Image = False).

That concludes this brief walkthrough of creating a data report with ArcGIS Diagrammer. Diagrammer is a free download from ArcScripts and includes full source code.
List of other online tutorials: