Today ESRI announced the launch of a new website entitled Mapping for Everyone. The site features an innovative four step web page for creating (and sharing) demographic maps. Developers can experiment with the free JavaScript, Flex and Silverlight APIs or browse user samples. Lastly, try ESRI’s free virtual globe called ArcGIS Explorer.
http://www.esri.com/mapping
Tuesday, October 20, 2009
ESRI launches Mapping For Everyone website


Wednesday, October 7, 2009
Tag Map Magnifier for Microsoft Surface
This video demonstrates a new proof-of-concept developed by the Applications Prototype Lab in Redlands, California for the Microsoft Surface.
The application was developed using ESRI’s ArcGIS API for WPF and utilizes Surface-specific tags to act as virtual map magnifiers. Tags are made up of a collection of domino-like black dots and are uniquely identified by the Surface device. Developers can retrieve the tag position, identifier code and orientation.
The lab used the tags to add additional Map UIElements to the display. As the user manipulates the tag, the magnifier map is repositioned and its map extent updated. The map insets initially have same scale as the base map, a small scrollbar is provided to allow the user to magnify the map (or “zoom in”).

Because tags are uniquely identified, if a user removes a tag and then places it back on the table, we are able to restore previous settings such as the map magnifier’s size and relative scale.
Friday, September 4, 2009
Dynamic Charting for ArcGIS Desktop
This post describes a new sample published by ESRI’s Application Prototype Lab and inspired by Jack Dangermond geodesign presentation at the 2009 ESRI International User Conference.
Dynamic Charting for ArcGIS Desktop is a free sample (with source code) available from the ESRI code gallery. The sample summarizes a layer’s features based on the length/area and grouped by unique values from the renderer. The differentiating factor between this sample and the out-of-the-box charting tools is that this sample updates dynamically even in an edit session.

Wednesday, August 26, 2009
How to create a data report with ArcGIS Diagrammer
ArcGIS Diagrammer is productivity tool for ESRI’s ArcGIS Desktop users. Diagrammer is primarily used to create or view geodatabase designs in a graphical editor. This post will examine data reporting, a feature of Diagrammer that might be useful to a wide variety of ArcGIS Desktop users.
Let’s say that you or your organization has an existing geodatabase. You may want to ask:
- Does my geodatabase have any empty feature datasets?
- Does my geodatabase have any feature classes with no data?
- Does my geodatabase have any subtypes with no data?
- Does my geodatabase have any feature classes with holes?
Diagrammer’s data reporter will help answer these questions. Below is a short walk-through of creating a data report for a sample geodatabase that is included with ESRI’s ArcTutor product.
After starting ArcGIS Diagrammer, click Tools > Data Report.

A new tab will be added to the application called Data Report. If the Properties Window is not visible then click View > Properties. In the Properties Window, click the ellipsis (…) button next to the Workspace property.
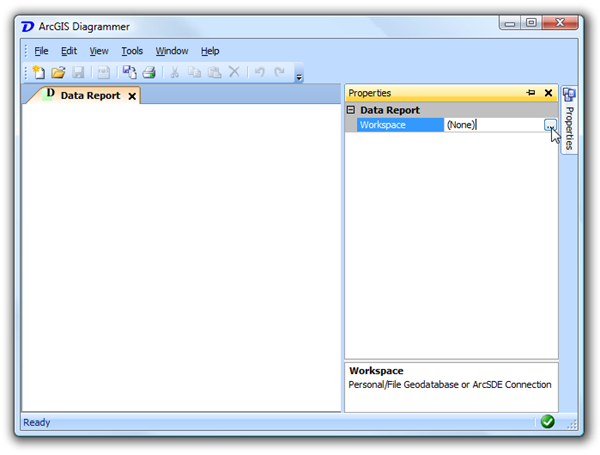
The ellipsis button will launch a dialog for navigating to (and selecting) a geodatabase or SDE connection. All geodatabase types are supported.

The selected geodatabase will be scanned for feature datasets, feature classes and subtypes. This may take a few seconds or minutes depending on the size and complexity of the geodatabase. When the scanning is complete a HTML report will be presented in the Data Report tab.

The report includes a header table and details about all feature classes, tables and subtypes. Most useful is the number of features/rows per feature class, table and subtype. Lastly, the report includes a small thumbnail representation of the data that, by default, hyperlinks to a larger image.

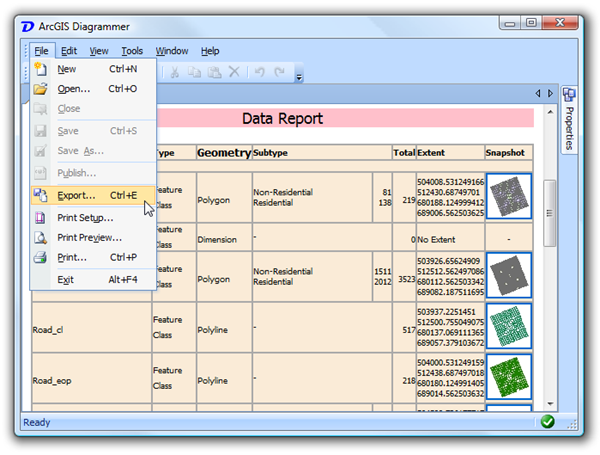
Data reports can be sent to a local printer/plotter or virtual printer should you wish to create a PDF document. Alternatively, reports can be exported to a new HTML document. To do so, click File > Export.
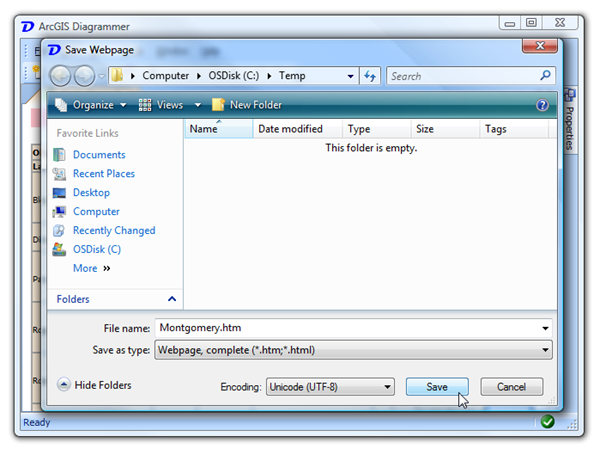
The save as dialog that appears will prompt you for the name and type of web document to create. By default, “web archive” is selected. We recommend you select “webpage, complete” as this will make a copy of the thumbnail images. The only disadvantage of exporting a report to HTML is that the larger linked images will not included in the output location. To prevent this, you can disable the creation of the larger images in the options dialog (see below).
This is an example of an export data report displayed in Windows Explorer.

When the exported HTML data report is viewed in a web browser, it looks identical to the report in ArcGIS Diagrammer.

Some options are provided to change the look and feel of data reports. To display the Diagrammer options dialog, click Tools > Options.

The data report options are located under the Report > Data tab. Most options are related to the font and the thumbnail images.

In the screenshot below I modified the font to be “Segoe Print” and increased the size of the small image to 200x200 and removed the larger linked image (Show Large Image = False).

That concludes this brief walkthrough of creating a data report with ArcGIS Diagrammer. Diagrammer is a free download from ArcScripts and includes full source code.
List of other online tutorials:
Tuesday, August 25, 2009
Site Suitability for Microsoft Surface
During the 2009 ESRI International User Conference, Jack Dangermond introduced his vision of geographic design or “geodesign”. Click here to view Jack’s presentation of his geodesign vision. To assist Jack’s presentation a few demonstrations were created to help illustrate his points. One such demonstration used a Microsoft Surface device to sketch planning areas on an interactive map.
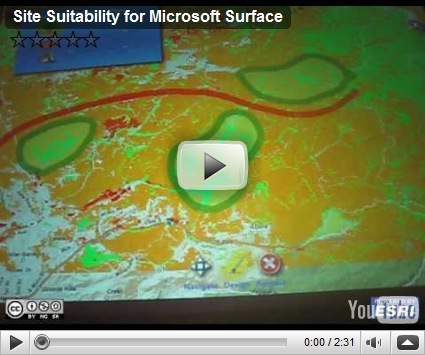
This application was developed using the ArcGIS API for WPF by the Applications Prototype Lab. The base map is from ArcGIS Online and the overlaid suitability maps were sourced from a local ArcGIS Server. A very basic application but it demonstrates the interactivity of a multi-user/multi-touch device for planning and communal design.
Subscribe to:
Posts (Atom)